Read next
Machine Learning
Metrics as an indicator of AI safety: is that enough?
The performance of machine learning (ML) models is typically assessed using metrics such as accuracy, precision, recall, F1 score, etc. But how trustworthy are these single point estimates really? Such metrics reflect reality only partially and can provide us with a false sense of safety. Especially in safety-critical areas, this can be dangerous. Fraunhofer IKS develops a formal framework for the quantification of uncertainty which aims to make the residual risk “more computable”.


© iStock/iiievgeniy
Machine learning (ML) is increasingly being used in safety-critical applications, for example perception tasks in the area of autonomous driving. But how safe are ML models really? Broadly speaking, there are two main approaches to tackle this question. The ML community develops metrics and techniques to evaluate the quality of a model according to various criteria. The safety community, on the other hand, analyses the causes of errors to ensure that the risk remains acceptable. The work done at Fraunhofer Institute for Cognitive Systems (IKS) aims to bridge the gap between these two worlds
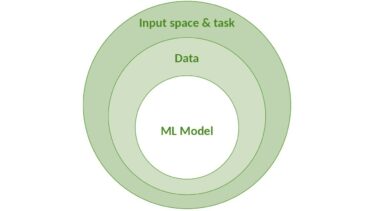
One of the publications of Fraunhofer IKS in this context considers the challenge of ML safety assessment against the background of uncertainty [1]. It argues that the identification and reduction of various factors of uncertainty is necessary for safety assurance. To this end, the causes of uncertainty are divided into three layers: (1) model, (2) data, and (3) environment (input space + task to be solved by the model), as illustrated in the onion model below:
© Fraunhofer IKS
The model illustrates the classification of uncertainty into three layers.
Imagine that a neural network used for classification achieves an accuracy of 99 percent in recognising pedestrians. Sounds pretty good. But what about the remaining one percent? And how reliable are these 99 percent when considering, for example, the calibration of the model, the quantity, quality, and coverage of the training and test data, or the quality of the environment specification? If even one of these components is weak, the significance of this single-point performance metric can be associated with high uncertainty.
A holistic perspective to safety is required
To be truly convincing, a safety argument must provide a holistic perspective and include evidence from all three of the aforementioned layers of uncertainty. However, these pieces of evidence should not be viewed in isolation. To this end, researchers at Fraunhofer IKS together with Prof. Simon Burton from the University of York are working on the development of a formal framework that helps to formally model and combine evidence in order to determine the overall uncertainty [2]. The framework is based on Subjective Logic [3], a formal approach that combines probabilistic logic with uncertainty and subjectivity. The goals are as follows:
1. Modelling the uncertainty in individual metrics such as accuracy, recall, precision, etc., which function as evidence in a safety argument.
2. Modelling the flow of uncertainty between different metrics and its propagation throughout the safety argument to determine the resulting assurance confidence.
Example: ML-based traffic sign recognition
Consider the example of ML-based traffic sign recognition which can, for example, be used as part of a highway pilot to activate or deactivate the automatic control of the vehicle depending on the current situation. The central component is a neural network for classification that has been trained on an appropriate dataset. Our goal is to ensure that the network misclassifies as few construction signs as possible.
Since the primary concern here is the avoidance of false negatives, i.e., cases where the model fails to recognise a construction sign, the focus is on recall (also known as sensitivity or true positive rate) as our primary metric. Suppose an analysis of the true positives and false negatives of the neural network yields the following results for the class of construction signs:
- Anzahl der True Positives (TP): 470
- Anzahl der False Negatives (FN): 10
Based on that, the recall of the model can be calculated as follows: TP/(TP+FN) = 98%. At first glance, this looks good, but the crucial question is how much this value can be trusted. To answer this, hidden influencing factors must be considered, which can, in turn, be divided into the three aforementioned layers: model, data, and environment.
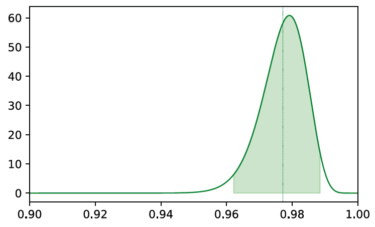
This is where the approach developed at Fraunhofer IKS can help. The recall measurement is modelled as a "Subjective Opinion," i.e. a mathematical construct that expresses the subjective belief in the measurement against the background of the amount of data used. This formalised opinion can be visualised as a probability distribution that describes how likely the recall value that has been measured really is:

© Fraunhofer IKS
The graph shows the Beta probability distribution of the measured recall value. The expected value of the distribution is shown as a green vertical line, the shaded area illustrates the 95% credible interval.
It becomes apparent that we cannot completely trust the originally measured value of 98%. The spread of the distribution indicates a certain level of uncertainty, which at this point, solely results from the limited number of data points (480) that we used as a basis for the measurement.
Now, how can the actual performance of the model be approximated? To this end, we can first determine the range in which the actual value lies with a certain probability (e.g. 95%), as shown by the shaded green area in the graphic above. To be on the safe side with the recall measurement, it can now be adjusted by, for example, using the lower bound of the green-shaded area as a more conservative estimate. This results in a corrected recall value of 96%, two percentage points below the originally measured 98%. And so far, only the size of the test dataset has been considered as a potential source of uncertainty, not other influencing factors!
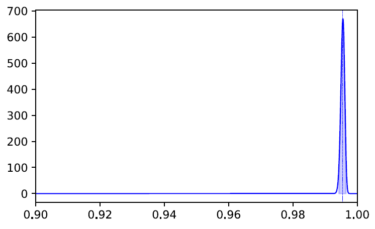
As a next step, we measure the calibration of the model, which in turn influences the correctness of the true positives and false negatives on which the recall calculation is based. One relevant metric in this case is the Brier score [4]. For the class of construction signs in the example, it amounts to 0.004 which indicates very good calibration. This measurement can now also be formalised as a subjective opinion and visualised as a probability distribution:

The graph shows the Beta probability distribution of the measured Brier score. The smaller variance in comparison to the previous graph indicates that the measurement is associated with less uncertainty
Now, things are getting interesting when both measurements are combined to express the belief in the original recall measurement against the background of the belief in the calibration:

The graph illustrates the combination of the previous two measurements (left and middle) as well as the comparison of the resulting combined measurement with the original recall value with respect to the uncertainty represented by the credible interval (right).
The right graph illustrates that the uncertainty in the original recall measurement (green shaded area) significantly increases when knowledge about the model's calibration is also included. The red shaded area describes the uncertainty of this combined measurement. From a safety perspective, the conservative estimate for recall should thus be adjusted further by one percentage point from the previous 96 percent to approximately 95 percent. With this new conservative estimate, we are now three percentage points away from the originally measured value of 98 percent!
This blog post is based on a paper by Benjamin Herd and Simon Burton entitled: "Can you trust your ML metrics? Using Subjective Logic to determine the true contribution of ML metrics for safety".
Of course, the process does not stop here and further influencing
factors from the model, data, and environment levels can (and should) be
taken into consideration. The combined modelling of individual
(previously isolated) metrics allows for a more holistic view of a
model's performance and makes the overall uncertainty more tangible.
The described approach of Fraunhofer IKS can thus, for example, make an
important contribution to the quantification of confidence in a safety
argument that aims to provide a structured justification – based on
various evidential artifacts – that the overarching safety goal has been
met.
References
[1] Burton, Herd (2023): Addressing uncertainty in the safety assurance of machine-learning. Frontiers in Computer Science, Volume 5
[2] Herd, Burton (2024): Can you trust your ML metrics? Using Subjective Logic to determine the true contribution of ML metrics for safety. Proceedings of the 39th ACM/SIGAPP Symposium on Applied Computing (SAC ’24)
[3] Jøsang, Audun (2016): Subjective Logic: a formalism for reasoning under uncertainty. Artificial Intelligence: foundations, theory and algorithms. Springer International Publishing Switzerland.
[4] Brier (1950). Verification of forecasts expressed in terms of probability. Monthly weather review 78, 1 (1950), 1–3.
This work was funded by internal Fraunhofer programs as part of the ML4Safety project.


