Read next
Out-of-distribution detection
Is it all a cluster game? A sneak peak into OOD detection problems
Can deep neural networks in image processing reliably recognize new, unknown test patterns? First considerations for different methods — especially for safety-critical applications.


© iStock/Michael Kiselev
Deep neural networks (DNN) have been extensively and successively applied to a variety of tasks, including problems related to vision (image/video as input data) such as image classification, object detection and so on. For this, DNNs are trained by being fed data (training data) and recognizing patterns in the training data distribution. However, when it comes to safety-critical applications, there is one key question: Can DNNs still be expected to perform reliably on test samples that are not represented by the training data, i.e., in-distribution (ID) data? Such new test samples which are significantly different from training samples are termed out-of-distribution (OOD) samples. An OOD sample could be anything, which means it could belong to an arbitrary domain or category. These OOD samples can often lead to unpredictable DNN behavior and overconfident predictions [1]. It is therefore essential to detect OOD samples, meaning that the system ‘knows when it does not know,’ so that additional fallback measures can be triggered [2].
So, can DNN still reliably perform OOD detection? This article presents some ideas that explore methods for ensuring this.
One promising approach to OOD detection is exploring the proximity of latent representations in the learnt embedding space so that related samples lie in close proximity compared to unrelated samples. This can be explained by imagining a space where all the semantically similar training data (images containing objects with similar shapes/structures) are clustered together into groups (e.g., clusters of cats, cars, ships, etc.), whereas OOD samples are placed far away from these known clusters.
Contrastive learning
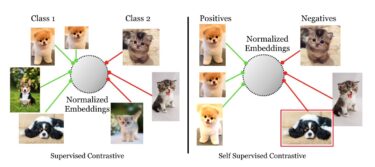
Contrastive learning (CL) has emerged as a very successful method in recent times and works on similar principle. It essentially clusters representations or learnt embeddings (numerical representations of different real-world objects as vectors) of similar instances or classes together while pushing apart dissimilar instances or classes. In supervised contrastive learning (SupCon) [3], the DNN tries to learn embeddings that cluster similar classes together in respective buckets (class 1, 2, etc.) while pushing apart samples from other classes. In self-supervised CL, e.g., SimCLR [4], there is no information about which class a given sample belongs to, so the DNN learns embeddings of similar samples which are clustered as ‘positives’ while pushing away dissimilar samples as ‘negatives’ as illustrated below.

© Khosla, P., Teterwak, P.,Wang, C., Sarna, A., Tian, Y., Isola, P., Maschinot, A., Liu, C., and Krishnan, D. Supervised Contrastive Learning. arXiv:2004.11362 , April 2020
Figure 1: Supervised CL encourages clusters based on classes of different categories, while self-supervised CL encourages clusters of positives and negatives [3]
Analyzing cluster formation in embedding space
After learning to separate embeddings based on their similarity using CL, the next focus is how the clusters look, or how well they are actually separated. While it is no mean feat to estimate the quality of clusters achieved, we have used the following metrics to allow better insight into the problem:
- Global separation (GS): This follows the reasoning that separability between clusters can be determined by inspecting intra-cluster and inter-cluster distances. Thus, the higher the GS, the more separated the clusters [5].
- Cluster purity (CP): This determines how many samples within a given cluster belong to the same class. This is particularly useful when the DNN is trained in an unsupervised manner, i.e., without class data.
Before we analyze the cluster formation of the different contrastive learning models, we also need a baseline model for reference. In this case, a DNN trained with simple supervised cross-entropy (CE) objectives serves as the baseline so that we are able examine the cluster formation for the SupCon and SimCLR contrastive learning models. The models have been trained on CIFAR-10 as ID data.

© Fraunhofer IKS
Figure 2: Global separation between different classes of CIFAR-10 data over time (epochs) for different models
The graphs above already indicate that supervised models like CE and SupCon show much better separation in terms of class-based clusters with much higher GS values over time (epochs) compared to self-supervised SimCLR, where similar samples were not learnt at class-level semantics but rather on a smaller semantic scale of positives and negatives.
Exploring OOD detection based on clusters
Having established a solid notion about the clusters of embeddings learnt using different CL methods, we must now explore whether it is possible to distinguish the ID clusters of training data from OOD samples or clusters. To do this, various distance-based metrics such as Mahalanobis distance, cosine similarity and so on can be used to calculate distances of ID and OOD samples. These distances can then be evaluated based on determined thresholds based on distance to the overall center of the ID cluster space (global score) or, for even more precision, they can be calculated to individual cluster centers (cluster score) and subsequently assigned to the closest cluster.

© Fraunhofer IKS
Figure 3: Illustration of contrastively learnt embedding clusters for supervised (SupCon) vs self-supervised (SimCLR) models
Because each test sample gets assigned as either ID or OOD, metrics such as AUROC (area under the ROC curve) can be used to determine how well the model can detect ID vs OOD test samples. As illustrated above, supervised methods like SupCon provide distinct clusters and hence perform well with taking multiple cluster-based distances, while self-supervised methods such as SimCLR produce overlapping clusters and thus distances from a single global cluster, also providing quite competitive OOD detection.
This blog article is based on the whitepaper "Is it all a cluster game? Exploring Out-of-Distribution Detection based on Clustering in the Embedding Space"
In general, it is difficult to conclude that a particular method is superior, and it largely depends on variables like the complexity of ID dataset, model, OOD data, distance metrics, dimensions of the space where latent representations are learnt and so on.
Although the problem with OOD detection is not yet completely solved, DNNs continue to gain incremental competence along these difficult tasks.
References
[1] Hendrycks, D. and Gimpel, K. A Baseline for Detecting Misclassified and Out-of-Distribution Examples in Neural Networks. arXiv:1610.02136 [cs], October 2018.
[2] Henne, M., Schwaiger, A. and Weiss, G. Managing Uncertainty of AI-based Perception for Autonomous Systems. In AISafety@IJCAI 2019, Macao, China, August 11–12, 2019, volume 2419 of CEUR Workshop Proceedings. CEURWS. org, 2019.
[3] Khosla, P., Teterwak, P., Wang, C., Sarna, A., Tian, Y., Isola, P., Maschinot, A., Liu, C. and Krishnan, D. Supervised Contrastive Learning. arXiv:2004.11362 , April 2020.
[4] Chen, T., Kornblith, S., Norouzi, M. and Hinton, G. A Simple Framework for Contrastive Learning of Visual Representations. In International Conference on Machine Learning, pp. 1597–1607. PMLR, November 2020
[5] Bojchevski, A., Matkovic, Y. and Günnemann, S. Robust Spectral Clustering for Noisy Data: Modeling Sparse Corruptions Improves Latent Embeddings. In Proceedings of the 23rd ACM SIGKDD International Conference on Knowledge Discovery and Data Mining, pp. 737–746, Halifax NS Canada, August 2017.
This project was funded by the Bavarian State Ministry of Economic Affairs, Regional Development and Energy as part of the project Support for the Thematic Development of the Institute for Cognitive Systems.


